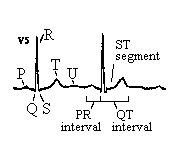
A normal adult 12-lead ECG

Normal adult 12-lead ECG
The diagnosis of the normal electrocardiogram is made by excluding any recognised abnormality. It's description is therefore quite lengthy.

- normal sinus rhythm
- each P wave is followed by a QRS
- P waves normal for the subject
- P wave rate 60 - 100 bpm with <10% variation
- normal QRS axis
- normal P waves
- height < 2.5 mm in lead II
- width < 0.11 s in lead II
- normal PR interval
- 0.12 to 0.20 s (3 - 5 small squares)
- normal QRS complex
- normal QT interval
- Calculate the corrected QT interval (QTc) by dividing the QT interval by the square root of the preceeding R - R interval. Normal = 0.42 s.
- Causes of long QT interval
- myocardial infarction, myocarditis, diffuse myocardial disease
- hypocalcaemia, hypothyrodism
- subarachnoid haemorrhage, intracerebral haemorrhage
- drugs (e.g. sotalol, amiodarone)
- hereditary
- Romano Ward syndrome (autosomal dominant)
- Jervill + Lange Nielson syndrome (autosomal recessive) associated with sensorineural deafness
- normal ST segment
- no elevation or depression
- causes of elevation include acute MI (e.g. anterior, inferior), left bundle branch block, normal variants (e.g. athletic heart, Edeiken pattern, high-take off), acute pericarditis
- causes of depression include myocardial ischaemia, digoxin effect, ventricular hypertrophy, acute posterior MI, pulmonary embolus, left bundle branch block
- normal T wave
- causes of tall T waves include hyperkalaemia, hyperacute myocardial infarction and left bundle branch block
- causes of small, flattened or inverted T waves are numerous and include ischaemia, age, race, hyperventilation, anxiety, drinking iced water, LVH, drugs (e.g. digoxin), pericarditis, PE, intraventricular conduction delay (e.g. RBBB)and electrolyte disturbance.
- normal U wave

