
 Basic UsageHeartThoraxTMPLeadsToolsFocusPreferencesCase FilesVersionsDownload case filesUpdate ECGSIMPublicationsLicense terms
Leads
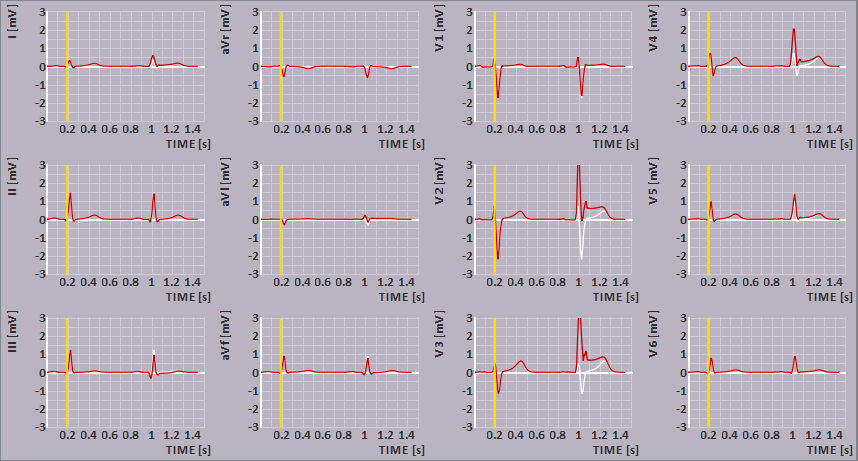
In most cases the leads view allows the display of the ECG signals observed by the following lead systems:
- the standard 12-lead system,
- the vector cardiogram according to the Frank lead system,
- a 64-lead BSPM system (WCT reference),
- a minimap montage of the unweighted nine signals (with WCT reference) observed at the nine electrodes sensing the standard 12-leads and
- a single lead positioned at either of the thorax nodes (WCT reference), see thorax mouse actions.
These lead system are part of the case file and thus can vary between different files.
The time bar (YELLOW lines) indicates the selected time instance, which may be changed by a single left mouse click or dragging; see also the beat selection.
For changing the displayed grid: see preferences.
Signals 
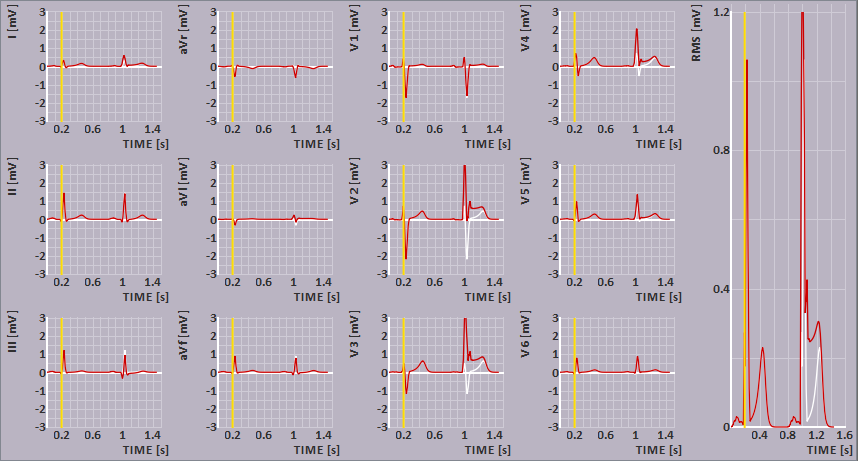
For each of the lead systems a superposition of up to three of the following ECG signals may be viewed. Apart from those three a RMS signal for each of them can be added as shown in the figure below.
the measured ECG signals, the simulated ECG signals based on the initial parameter settings, the simulated ECG signals with adapted parameter settings, 
the electrogram for the selected point on the heart will be shown. This electrogram will be shown in the TMP pane. 
the RMS for each of the shown ECG signals.
Coupling / filtering
In the coupling menu, you may choose the type of temporal filtering applied to the ECGs.
If you choose baseline correction (the default value) the mean value of the potentials is set such that their values at the beginning of the P wave and at the termination of the T wave are zero. If you choose AC coupling the mean of the potential over time will be set to zero for all leads (as results from AC coupling without baseline correction). If you choose DC coupling no filtering of the ECGs is applied (the true DC level is shown).
Beat / time selection
If surface potentials are displayed in the
Heart or thorax
views, the vertical YELLOW lines visible
in the plots indicate the time instant for which the potential maps are displayed.
The time instant may be set by clicking on the left mouse button within the leads view or by
dragging the line to the desired position with the mouse while holding down the left mouse
button. You may also press the left and right arrow keys to in- and decrease the selected time with
steps of 2 ms.
When the case file contains more then one beat (atrial and/or ventricle), you can zoom in to one beat
by double clicking with the left mouse button on a time moment withing the desired beat. The choice
between the ventricle or atria information shown in the TMP pane is determained by the current shown
part in the heart pane.
To restore the signals to show all beats, double click the left mouse button again.
When an interval is being selected in this leads view, the same interval will be indicated in the TMP pane. This will be done by making the part(s) that do not belong to the selected interval a bit lighter in color.
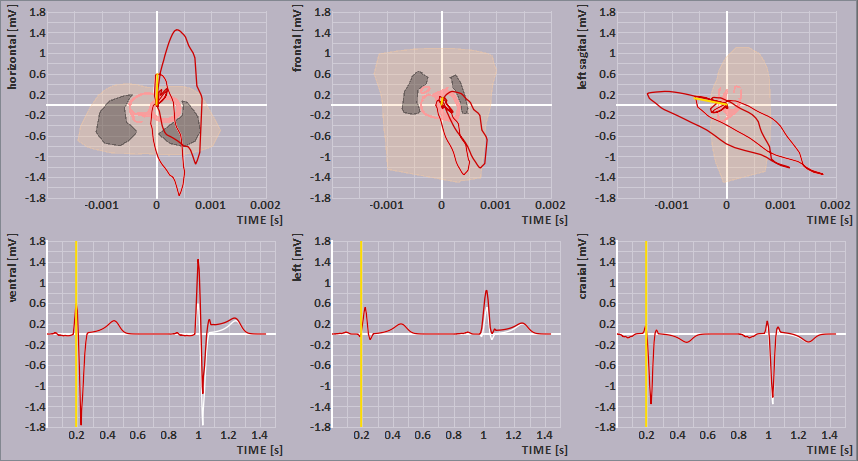
Vector cardiogram (VCG)
The VCG is derived from the Frank lead system. Three cross sections of the thorax are shown, drawn through the center of gravity of the ventricular myocardium. The loops shown are the projections of the 3D vector loop onto each of the planes.
Note: The horizontal plane is viewed from the feet.
Scale
The amplitude scale can be changed by scrolling the mouse wheel.
Copying the content of the leads view
The image shown in the leads view may be copied to the clipboard by selecting -Copy- from main menu item -Edit- and then choose -ECG-, or by pressing <Ctrl>-C while the mouse is within the leads view.